Data Analytics Final Report
Date Range:
Jan14 - May 14, 2024
Download the Final Report .pdfGoogle Analytics 4 GA4 provides indispensable metrics and insights for evaluating the performance and effectiveness of my personal Website. By leveraging these analytics, I gain a comprehensive understanding of user behavior, traffic sources, engagement patterns, and conversion metrics. This knowledge empowers me to make informed decisions regarding my digital strategy, optimize user experience, and enhance the impact of my marketing initiatives.
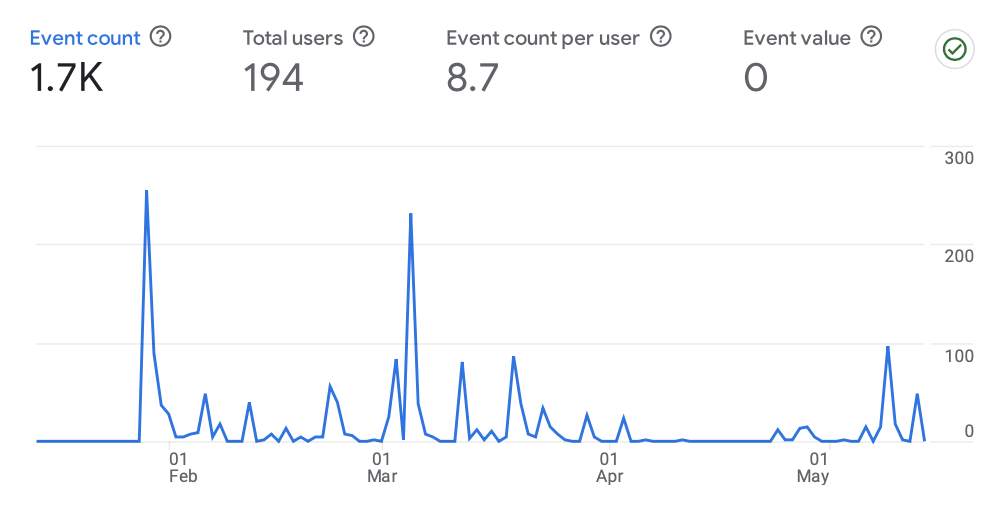
In this report, I focused on analyzing user behavior, particularly Page View Events, since the inception of the website four months ago. During this period, the website attracted 194 users, each engaging approximately 8.7 times on average. This high level of engagement resulted in a total of 1.7K recorded events, encompassing various user actions such as clicks, scrolls, and submissions through the Contact form. These metrics provide valuable insights into user engagement, highlighting the number of users, their interaction frequency, and the types of actions they perform
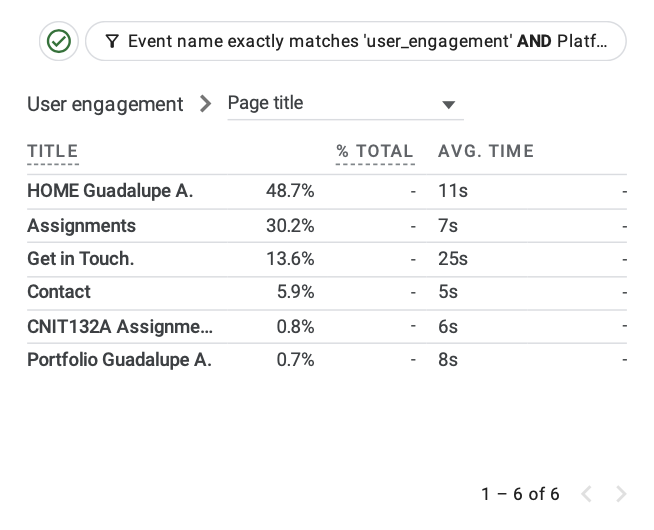
Notably, the user engagement is significant, with the "Home Guadalupe A" page serving as the landing page and contributing to 48.7% of user engagement. The "Assignments" page followed closely, representing 30.2% of engagement with an average session duration of 7 seconds. Additionally, the "Get in touch" page exhibited the highest average session duration at 25 seconds, indicating active user interaction, potentially including form submissions. These insights enable me to evaluate page performance, identify high-performing content, and areas for improvement, guiding my efforts to enhance user experience and website performance.
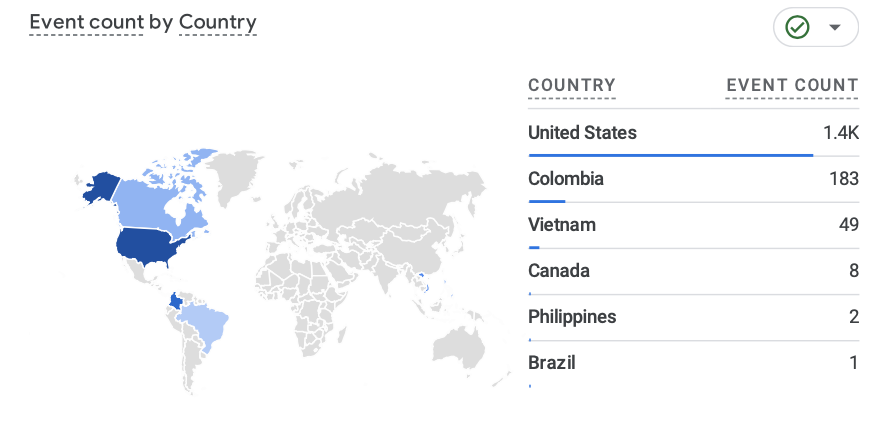
The geographical map visualization provided a clear overview of event distribution by country, identifying the top six countries contributing to site engagement. The United States led with 1.4 thousand events, followed by Colombia, Vietnam, Canada, the Philippines, and Brazil. This geographical insight informs my global marketing strategies and localization efforts, allowing me to tailor content and campaigns to specific regions and demographics.
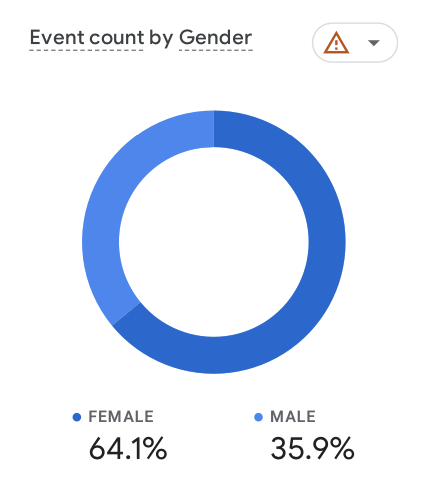
Furthermore, the Event Count per Gender metric revealed that 64.1% of users are female, while 35.9% are male. This information provides valuable demographic insights, which can be used to customize content and campaigns to better target specific audiences.
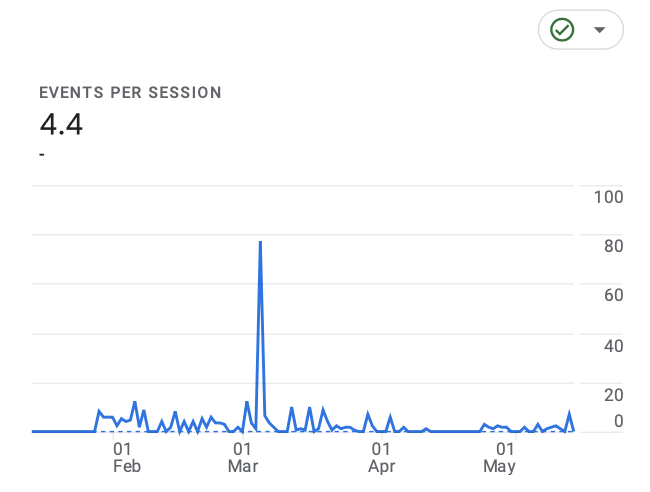
Finally, events per session, averaging 4.4 interactions, indicate active user engagement during each session. This metric underscores the importance of website design, content relevance, and effective calls to action in encouraging user interaction.
In summary, the insights provided by Google Analytics 4 have been instrumental in guiding my digital strategy, optimizing user experience, and maximizing the impact of my marketing efforts. By continuously analyzing these metrics, I aim to further enhance my website's performance and deliver a more tailored and engaging experience for users.