Unlocking insights with Google Analytics
In the dynamic landscape of digital presence, understanding user behavior, engagement patterns, and the performance of your online assets is paramount. This report will explain how to use Google Analytics tools and insights to improve your decision-making.
Google Analytics serves as a powerful lens, providing a comprehensive view of how users interact with your website or application. From the pages they visit to the time spent on each section, it unravels the intricate tapestry of user engagement. This report aims to decipher the data, offering valuable perspectives on audience demographics, traffic sources, and the overall efficacy of your online presence.
Average Engagment Basics
What is Average Engagement?
 After a website has been online for some time, it's essential to analyze how users engage with its content. Average engagement time is a metric that measures the average duration users spend on a website or specific pages. A lower average engagement time may indicate that users are quickly navigating through the site without deeply engaging with the content, potentially signaling issues with usability, content relevance, or site performance.
Conversely, a higher average engagement time suggests that users are more immersed in the content, exploring multiple pages or engaging in interactive elements.
After a website has been online for some time, it's essential to analyze how users engage with its content. Average engagement time is a metric that measures the average duration users spend on a website or specific pages. A lower average engagement time may indicate that users are quickly navigating through the site without deeply engaging with the content, potentially signaling issues with usability, content relevance, or site performance.
Conversely, a higher average engagement time suggests that users are more immersed in the content, exploring multiple pages or engaging in interactive elements.
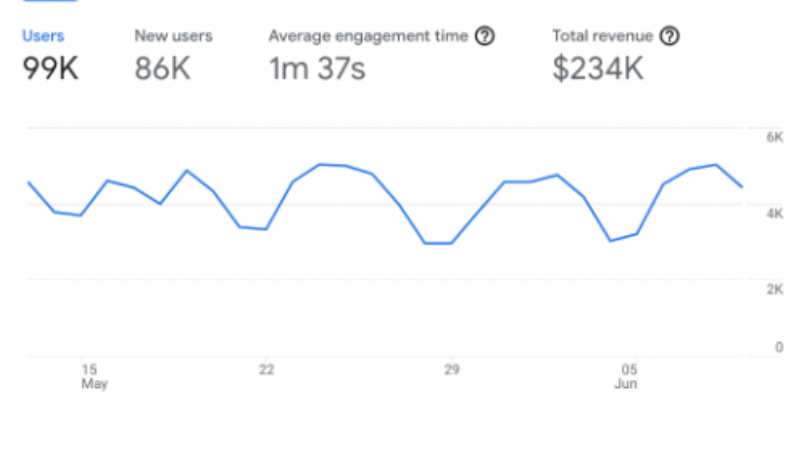
In the picture above, we observe:
-
Average Engagement Duration: 1 minute and 37 seconds
Typical amount of time users spend interacting with the website's content and features during their visits.
-
Number of New Users: 99,000
Individuals who visited the website for the first time within the given timeframe.
-
Total Number of Users: 86,000
Total count of unique individuals who visited the website within the specified timeframe, including both new and returning users.
-
Discrepancy in Number of Users:
The number of users is larger than the number of new users, indicating returning users in addition to new ones.
Some individuals have visited the website before and are returning within the specified timeframe.
Practical uses of Average Engagment
-
Compare and contrast sections of a website
Average engagement time can be used to compare and contrast average engagement time between pages and sections of a website to determine which content resonates most with users and which areas may need improvement. For example, pages with consistently low average engagement times, high bounce rates, and/or confusing content may suggest that the content or the user experience on these pages is not compelling or relevant for visitors. Companies can use this information to improve relevance, clarity, content quality, page layout, and visual appearance to increase user engagement.
-
Segmentation by Traffic Source
Organic searches, direct traffic, and referrals are three distinct sources through which users arrive on a website.
Organic Searches: Refers to traffic that is visiting a website through search engines like Google, Bing, or Yahoo. These users entered specific keywords or phrases into a search engine with the intention of finding relevant content and are actively seeking specific information or solutions.
Direct Traffic: Consists of visitors who come to your website by typing the URL directly into their browser's address bar or accessing it from a bookmarked page. Direct traffic is typically composed of users who are already familiar with your website or have heard about it through offline channels.
Referral Traffic: Refers to visitors who land on your website by clicking on a link from another website. These links can come from a variety of sources, including social media platforms, other websites, online directories, or online advertisements. Referral traffic is significant because it indicates that other websites are referring their visitors to your site, which can help increase your website's visibility and reach.
Different traffic channels attract users with varying intents. For instance, users arriving from organic searches actively seek specific information, while those from social media referrals may browse casually. Segmenting average engagement time by traffic source helps identify user behavior patterns and assess marketing strategies.
So how does this work? Website owners can use segmented traffic metric to Assess User Engagement: and Evaulate Marketing Channels
-
Assessing User Engagement:
If a website owner for a cooking channel notices that a significant portion of their website traffic is coming from organic search results related to healthy cooking recipes. Then they might consider optimizing their website content further for relevant keywords related to healthy cooking, such as adding more detailed recipe descriptions, nutritional information, or cooking tips to increase use engagement. On the other hand if they find that a large portion of their traffic is coming from social media platforms like Instagram or Facebook, they might focus on creating visually appealing content, such as cooking demonstration videos or recipe images, to better resonate with their social media audience. Lastly if they notice a considerable amount of referral traffic from a specific website or blog that features their recipes, they could explore opportunities for collaboration or partnership with that website to further promote their content and reach a broader audience.
-
Companies can evaluate the effectiveness of their marketing channels:
by comparing average engagement times across different channels such as organic search, direct traffic, referrals. Higher average engagement times may be indicative of that users from certain channels are more engaged and interested in the content, suggesting that traffic from a those sources/channels are driving quality traffic to the website.
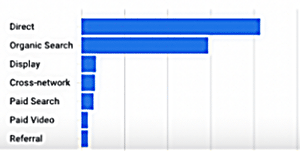
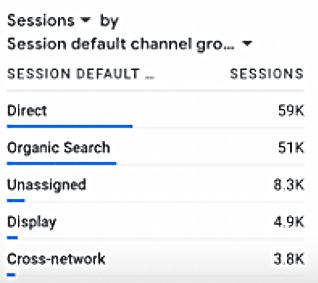
Analyzing Visual Data
The graphs on the left show that the majority of traffic comes from direct sessions and organic search, 59K and 51K respectively followed by other sources such as unassigned, display, and cross-network. For example, organic and direct searches are our primary source of web traffic it indicates that our search engine optimization (SEO) efforts are successful in driving traffic.
The following results also indicate that our website might benefit from the following investments:
- Search Engine Optimization (SEO): Enhancing website content with relevant keywords and metadata to improve organic search rankings.
- User Experience and Engagement: Improving website usability and user experience to encourage visitors to stay longer and explore more pages.
Segmenting Web Traffic by Technology
Web traffic can be segmented by various factors such as:
- Device type (mobile, desktop, tablet)
- Operating system (iOS, Android, Windows, macOS)
- Browser (Chrome, Firefox, Safari, Edge, etc.)
- Screen resolution
- Internet connection speed
Website owners can leverage this information to gain insights into user behavior and preferences. For example:
- Identifying which devices and browsers are most commonly used to access the website.
- Optimizing the website's layout and functionality for specific devices or browsers.
- Understanding how different user segments interact with the website and tailoring marketing strategies accordingly.