CNIT 132A – Advanced HTML & CSS
Google Analytics
This report offers an analysis of critical metrics, diving into the significance behind average engagement time and the relationship between total users and new users.

CNIT 132A – Advanced HTML & CSS
This report offers an analysis of critical metrics, diving into the significance behind average engagement time and the relationship between total users and new users.

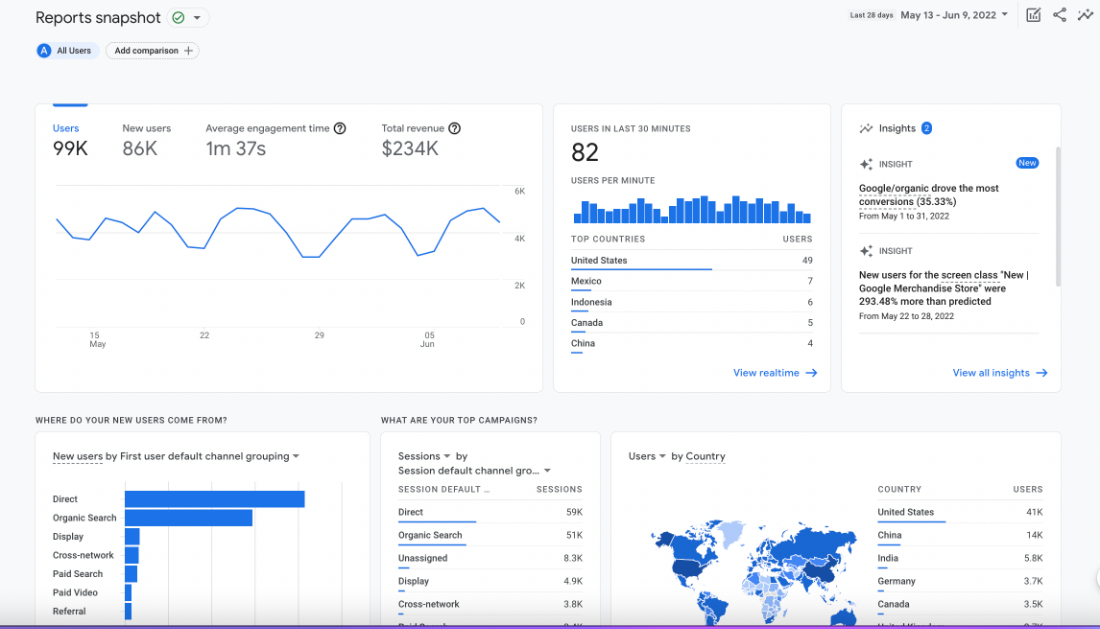
At the forefront of the Google Analytics dashboard, the initial graphic spotlights the average engagement time, a pivotal metric indicating users' duration on the website. This numerical representation sums up the collective time users invest in exploring the site's content. A higher average engagement time signifies user satisfaction, suggesting that the content resonates with their interests. Conversely, a lower average engagement time may signal a disconnect between user expectations and the provided content.
Understanding this metric is vital for tailoring content to meet user expectations and optimizing the overall user experience. It provides valuable insights into the effectiveness of the website in capturing and retaining user attention.
A peculiar observation arises when examining the graphical representation of user data – the number of users exceeds the number of new users. This incongruence stems from including returning visitors in the total user count. While new users represent first-time visitors, the user count encompasses both new and returning visitors. This revelation is crucial for deciphering user composition, discerning the ratio of new to returning visitors, and assessing user retention strategies.
Understanding these intricacies aids in crafting targeted strategies for both user acquisition and retention, ensuring a balanced approach that caters to the diverse needs of the audience.
The subsequent segment scrutinizes the New Users by First User Default Channel Grouping, shedding light on three primary channels - Direct, Organic Search, and Referral.
Understanding the dynamics of these channels allows businesses to fine-tune their marketing strategies, optimizing for the sources that yield the most engaged and valuable users.
Given the substantial number of new users within the specified date range, a natural curiosity emerges regarding their device preferences. To ascertain whether these new users predominantly access the site via mobile devices, one can navigate to the Tech section under the User group in Google Analytics. This specific data segment provides granular insights into the types of devices users employ to engage with the website.
Understanding mobile usage patterns is imperative for optimizing the website's mobile responsiveness, ensuring a seamless user experience across various devices. It enables businesses to stay ahead in the mobile-centric landscape, where a significant portion of online interactions takes place.