CNIT 132A – Advanced HTML & CSS
Analysis from Feb 15 – May 14, 2024
CNIT 132A – Advanced HTML & CSS
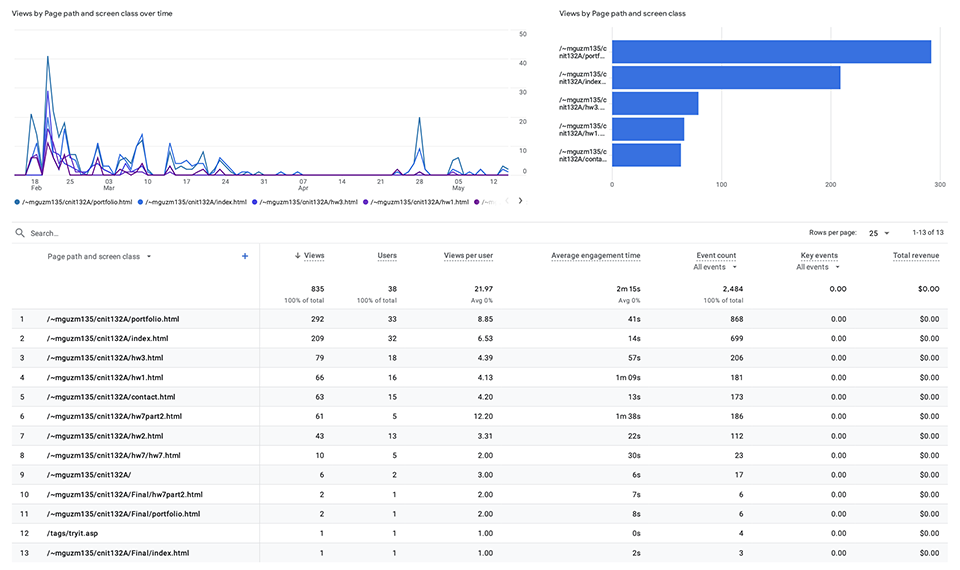
This report analyzes the web traffic for the portfolio website from February 15, 2024, to May 14, 2024. I will review the data for the top 8 pages in the table below. A PDF copy of the report can be downloaded here: Analytics Report for Mike Guzman's Portfolio
| Page | Views | Users | Avg. Time |
|---|---|---|---|
| 835 | 38 | 2m 15s | |
| /portfolio.html | 292 | 33 | 41s |
| /index.html | 209 | 32 | 14s |
| /hw3.html | 79 | 18 | 57s |
| /hw1.html | 66 | 16 | 1m 09s |
| /contact.html | 63 | 15 | 13s |
| /hw7part2.html | 61 | 5 | 1m 38s |
| /hw2.html | 43 | 13 | 22s |
| /hw7/hw7.html | 10 | 5 | 30s |
During the date range, all pages had a total of 835 views. The portfolio page and the homepage (/index.html) had the most views due to the links shared the most throughout the semester and the two main pages to navigate through the website.
A total of 38 users visited the website during the date range. As you can see, many users viewed multiple pages as they navigated through the website. Once again, the pages with the highest traffic were the portfolio page and the homepage, as they were the most shared links.
The last column of the table shows the average time users spend on each page. You will notice that the page with the most prolonged user engagement is /hw7part2.html. It was one of the last and more tricky assignments, resulting in the other students inspecting the code.
The assignment for CSS animation/hw7.html is absent from this list. I did not share the link to that page with the class because of technical problems.
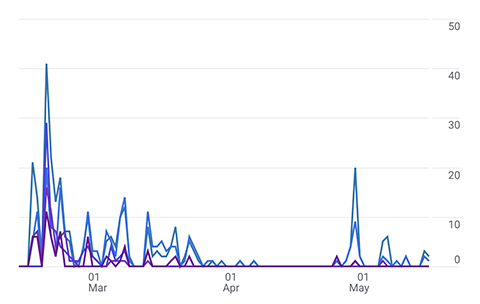
The illustration on the right shows the number of views the website received daily during the report’s date range. As you can see, the most traffic occurred at the beginning of the semester, when the class reviewed each other’s websites more frequently. Traffic slowed down during the middle of the semester and spiked back up a little towards the end. The spike at the end might be due to the complexity of the class assignments and the students inspecting each other’s code in more detail.
Google Analytics is a valuable tool that allows you to see what content engages users the most and re-examine the content that gets the least engagement. Seeing the number of page views can help you understand how effective your marketing and promotions are. If you work on web design, development, or content creation, Google Analytics is a must-have.